Vision-language-action (VLA) and world-action models (WAMs) often degrade under out-of-distribution task variations despite retaining partial task capability. To recover such capability, we propose RoboIRS, an inference-time internal representation steering method that uses successful and failed rollouts to train linear classifiers, select outcome-relevant intervention locations, and derive task-specific steering directions without updating policy parameters. On 15 simulation tasks with a frozen π0.5 policy, RoboIRS improves the average success rate from 44.4% to 66.2%, outperforming alternative inference-time intervention baselines while adding little inference time. We further validate RoboIRS on real-robot manipulation using the same π0.5 policy and demonstrate its applicability to a world-action model Cosmos Policy, where the average success rate improves from 35.4% to 55.4%. These results show that directly steering internal robot-policy representations can improve the performance of robot policies at inference time.
VLA and world-action policies degrade on out-of-distribution inputs — unseen scenes, novel object layouts, new appearances. But degradation is rarely total: the same policy still succeeds on a fraction of those rollouts. That partial competence suggests the internal computation required for success is still present, just not reliably expressed.
Language models produce both truthful and untruthful answers to near-identical prompts, and mechanistic interpretability has shown those behaviors live along linear directions in the residual stream that can be causally manipulated. Inference-time intervention, contrastive activation addition, and representation engineering all exploit this.
Can we steer the internal representations of a frozen robot policy at inference time to recover task performance under distribution shift?
Prior robotics work localizes interpretable features or steers a few predefined behavioral attributes (motion speed, end-effector height), or requires carefully matched nominal/perturbed observation pairs. RoboIRS instead derives its intervention directly from outcome-labeled rollouts — what succeeded and what failed — and targets general task success.
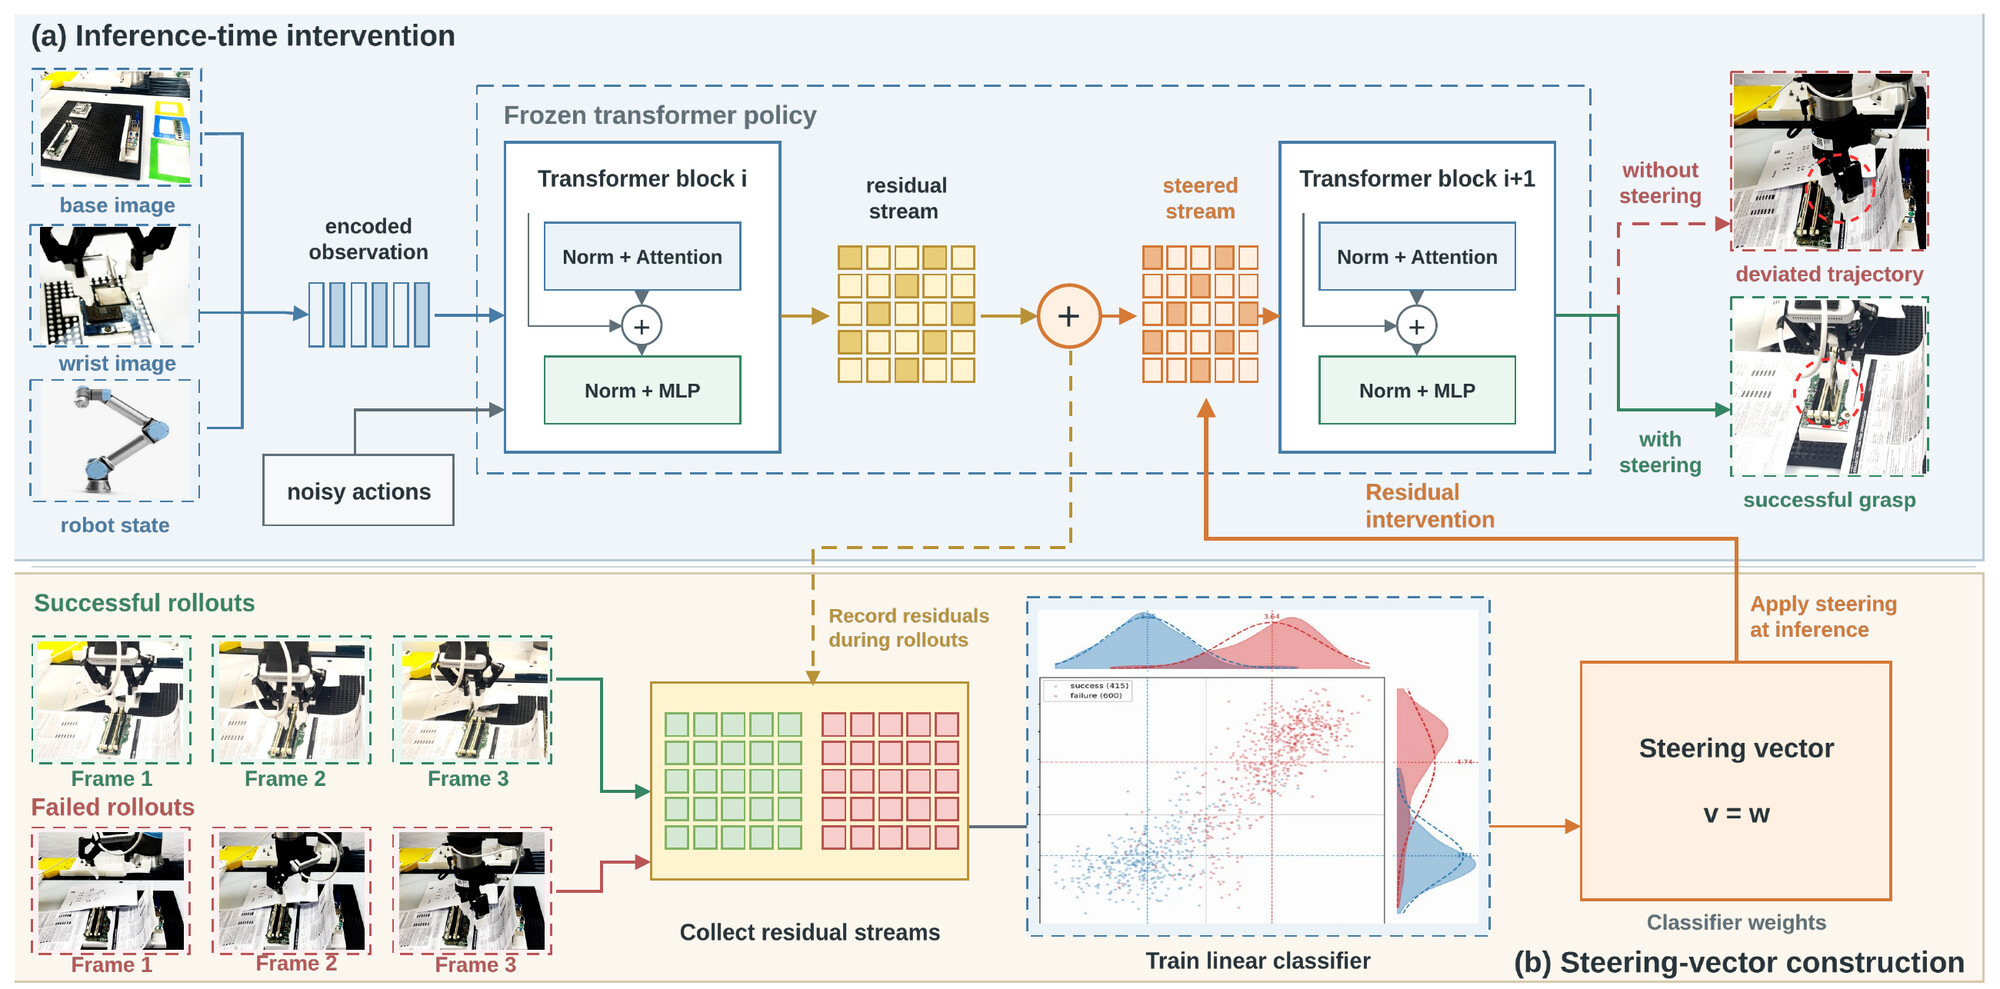
RoboIRS intervenes between transformer blocks of a frozen policy. The steering direction comes from a linear classifier trained to separate success-like from failure-like residual streams; the intervention site is chosen by that classifier's validation AUC.
Roll out the frozen policy and record the residual stream Rℓ,t,n at every timestep t, layer ℓ, and denoising step n. For π0.5 a 30-step rollout yields a (30, 18, 10, 10, 1024) tensor. Up to 10 successful and 10 failed rollouts per task — that is the entire data cost.
Per layer and action-token position, train P(y=1 | x) = σ(w⊤x + b) where y=1 marks failure. Successful rollouts label all timesteps 0; a failed rollout labels timesteps 1 from the step its end-effector leaves the space swept by successful trajectories. The weight w is the steering vector. Average validation AUC: 0.88; all classifiers train in under three minutes on CPU.
Exhaustive sweeps over intervention sites are prohibitive in robotics — each candidate needs multi-step closed-loop rollouts. Instead, within each layer pick the action-token position with the highest held-out failure-detection AUC, and steer only at the final denoising step:
α sets steering strength as a fraction of the residual norm, which keeps the intervention scale-consistent across layers. The sign s is chosen empirically: we read v as a task-relevant latent factor that can be under- or over-activated, not as a fixed failure→success arrow.
Each row shows the same π0.5 policy three times. First on the original LIBERO task, where it is in-distribution and succeeds. Then on the LIBERO-PRO perturbation of that task, where it fails. Then on the same perturbation with RoboIRS steering enabled — same frozen weights, same initial state as the failure, only the residual stream is modified. Clips play at 2× speed.
After the object-position swap the unsteered policy consistently confuses alphabet soup with butter. This is a decision-making failure, not an execution failure — the category steering helps most (+24.9 points on average).
The largest single-task gain in the benchmark: an action-precision failure mode, where the policy repeatedly re-attempts an imprecise grasp until timeout.
Re-ranking reaches only 32.0% here and CAA 16.0%, while RoboIRS reaches 72.7% — the classifier-derived direction carries information that candidate scoring alone does not recover.
Steered with s = +1. The sign is task-specific: we read the steering vector as a latent factor that can be under- or over-activated, not as a fixed failure→success arrow.
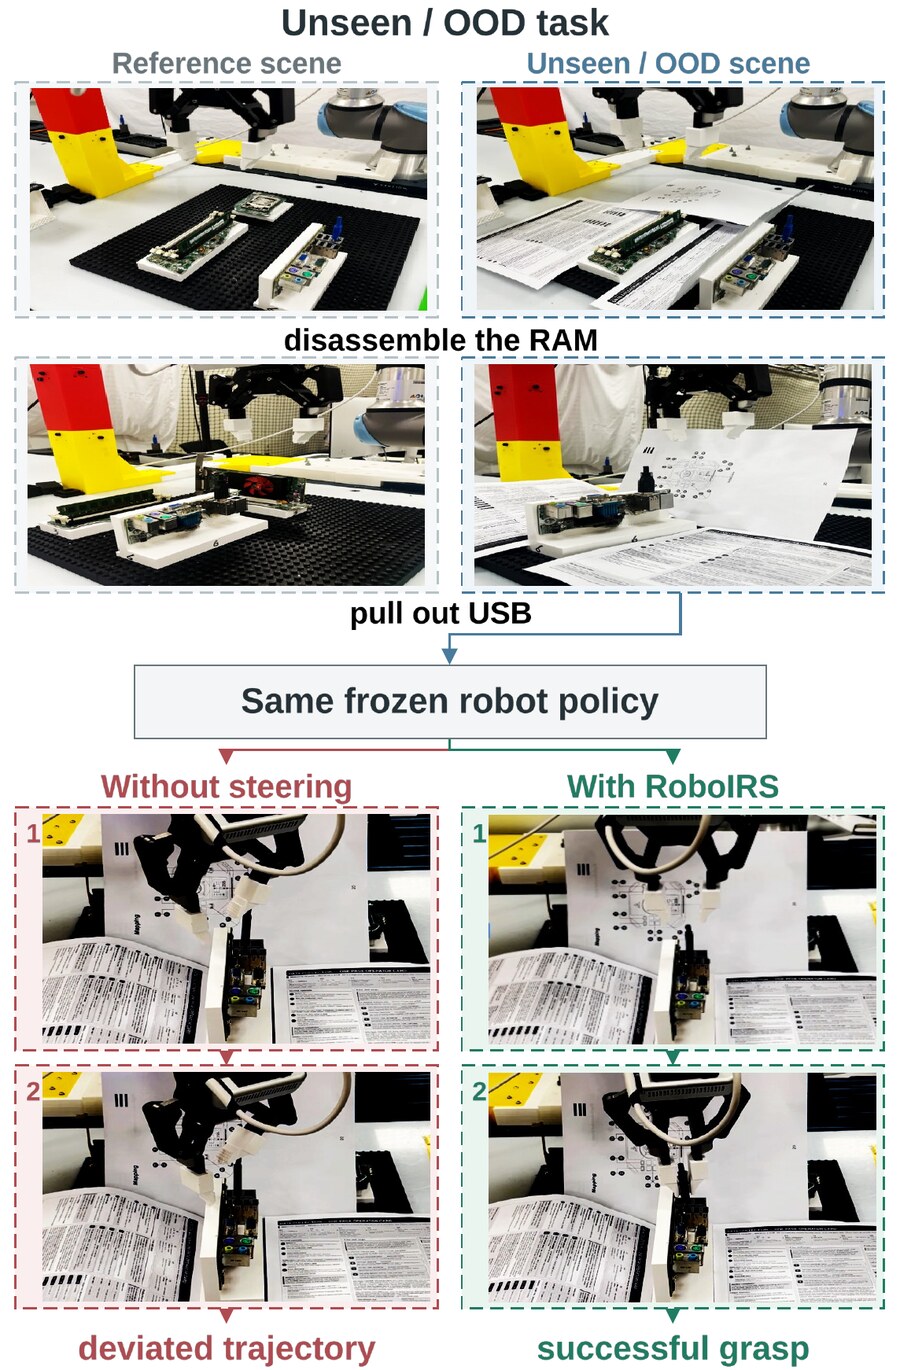
A π0.5 policy fine-tuned on demonstrations collected against a clean background, then evaluated with printed paper sheets scattered across the workcell — a pure visual distribution shift. 50 trials per condition per task.
Cosmos Policy has a different architecture (DiT) and a different training recipe: no separate action expert, actions decoded by averaging a 196-token action frame generated by a video diffusion transformer. We steer all 196 tokens of the final transformer block, with the classifier trained on mean-pooled residuals. Macro-average success rises 35.4% → 55.4%; 6 of 8 tasks improve meaningfully.
Both pairs use matched episode seeds. Unlike the π0.5 rows above, no unperturbed Cosmos Policy rollouts were available, so these comparisons show the perturbed conditions only.
All numbers are π0.5 on the same 15 LIBERO-PRO tasks, 150 rollouts over 3 random seeds per cell. Every baseline keeps the policy frozen and intervenes only at inference time, and each one is given the same successful and failed rollout data RoboIRS uses, with its strength chosen by the same validation protocol.
Sampling K=16 action chunks and scoring them reaches 58.6%, but pushes average inference from 134 ms to 1075 ms. RoboIRS adds 2.4 ms. Re-ranking also wins on only 7 of 15 tasks and by an average of 9.7 points, while RoboIRS wins the other 8 by 22.7.
Contrastive activation addition uses the mean success−failure difference at the same intervention sites, reaching 62.6%. It is the strongest baseline overall and beats RoboIRS outright on L4 and L5, but trails on average because its direction is not selected by a held-out criterion.
Guiding the flow velocity with ∇a log P(success) lands at 43.6%, below the unsteered policy. The classifier leans almost entirely on the encoded state, so the action-space gradient is weak; an action-only classifier yields 43.5%.
| ID | Suite | Task | Unsteered | Grad. | Re-rank K=16 | CAA | RoboIRS |
|---|---|---|---|---|---|---|---|
| L1 | goal_env | Open top drawer; put bowl inside | 12.0 | 12.7 | 44.7 | 34.0 | 34.0 |
| L2 | goal_env | Put bowl on plate | 32.7 | 30.7 | 74.0 | 68.7 | 96.7 |
| L3 | goal_env | Put bowl on cabinet | 72.0 | 58.7 | 79.3 | 75.3 | 89.3 |
| L4 | goal_env | Put wine bottle on cabinet | 17.3 | 19.3 | 51.3 | 94.0 | 68.0 |
| L5 | goal_swap | Put bowl on plate | 70.0 | 63.3 | 70.7 | 85.3 | 66.7 |
| L6 | object_env | Alphabet soup to basket | 59.3 | 56.7 | 79.3 | 66.0 | 71.3 |
| L7 | object_env | BBQ sauce to basket | 80.7 | 83.3 | 98.7 | 95.3 | 95.3 |
| L8 | object_env | Ketchup to basket | 84.7 | 80.0 | 92.0 | 82.0 | 84.7 |
| L9 | object_env | Milk to basket | 19.3 | 20.7 | 32.0 | 16.0 | 72.7 |
| L10 | obj_swap | Alphabet soup to basket | 39.3 | 43.3 | 31.3 | 75.3 | 90.0 |
| L11 | obj_swap | Butter to basket | 32.0 | 34.7 | 21.3 | 59.3 | 43.3 |
| L12 | spatial_env | Bowl between plate/ramekin to plate | 40.7 | 43.3 | 64.0 | 48.0 | 36.7 |
| L13 | spatial_env | Bowl in top drawer to plate | 25.3 | 29.3 | 32.0 | 36.0 | 34.0 |
| L14 | spatial_env | Bowl next to plate to plate | 58.7 | 58.0 | 68.0 | 75.3 | 76.7 |
| L15 | spatial_env | Bowl next to ramekin to plate | 22.0 | 20.7 | 40.7 | 28.7 | 33.3 |
| Average SR (%) | 44.4 | 43.6 | 58.6 | 62.6 | 66.2 | ||
| Win margin, baseline over RoboIRS | 3.7 (2/15) | 6.6 (1/15) | 9.7 (7/15) | 14.8 (5/15) | — | ||
| Win margin, RoboIRS over baseline | 27.8 (12/15) | 24.6 (14/15) | 22.7 (8/15) | 15.9 (8/15) | — | ||
| Average inference time (ms) | 134.0 | 137.9 | 1074.9 | 136.3 | 136.4 | ||
Highest value in each row is marked. Win margin rows report the average success-rate difference over the subset of tasks where that method wins, with the number of tasks won in parentheses — so a method can win more often yet by a smaller margin.
Citation information will be posted once the paper is published.
@inproceedings{TBD,
title = {TBD},
author = {TBD},
booktitle = {TBD},
year = {TBD}
}